
London Calling: the latest on bonds and the Fed (again)
It’s said in London that you can wait for 20 minutes for a red bus, then three come along at once. It feels a bit like that for fixed income events at the moment, but hopefully you get the sense from below there’s a lot going on in bond land. A combination of interesting, exciting and sometimes surprising events, which we will try to tackle, make sense of, and put into context.
The Federal Reserve
We’ve all read various summaries of what was said during the June meeting of the Federal Reserve (Fed) and what is expected, but to us it looks hawkish by bringing forward the expectation of interest rate rises. The “dot plot”, which summarises the FOMC participants outlook for interest rates, was bought forward to now expect two hikes in 2023, although Powell himself was somewhat dismissive of the dot plot, perhaps suggesting there are widening differences on the Committee. So maybe hawkish with some internal dissent.
There has also been some speculation that the Fed has blinked earlier than expected, by association rowing back on the average inflation targeting (AIT). Whatever the conclusion, a more hawkish Fed should point towards higher yields, but as ever life is not that simple.
Rates
US rates have been rallying since the 10-year peaked at 1.74% at the end of March to a low of 1.44% last Friday (11 June). Rates moved slightly higher before the Fed announcement, but the real action was afterwards as they sold off aggressively into the market close. Whilst many may have expected this to continue, the following day saw a huge rally to offset the previous day’s losses and ten-year Treasuries are now back to ‘pre-Fed’ levels. A surprising move given the change in stance, but maybe once again more explained by more by investor positioning than economic fundamentals.
We had been building a duration view over the last few months to benefit from a rallying bond market, and from a low of 1.5 years in February we sat at a high of around four years pre-Fed. Given the elevated volatility and mixed signals from the market, we are happy to once again step back a little from duration until things settle and have brought overall duration back down to two years.
Curve
This is exciting. Looking at the difference between US 5-year bonds and 30-year bonds, we saw a big steepening of yield curves in late 2020 and early 2021. With short-dated bonds not moving, in line with an unchanged interest rate outlook, the sell-off had been focused around longer-dated bonds which had materially underperformed until March. For the last few months, we have talked about the relative cheapness of long-dated bonds. What has been happening over those past few months is that the curve has been flattening, which materially accelerated this week. The size and speed of the move feels like many investors have been forced to aggressively cut their steepening trades, meaning a rotation from short-dated bonds into long-dated.
We have talked with many clients over the last few months about our preference for a US steepening bias in Q1 and a flattening in Q2. Our initial increase in rates exposure in April was in 30-year Treasuries, and during the week of the Fed meeting we added another one year of long-dated bonds, whilst reducing medium-dated exposure by 1 year.
Given the magnitude of the move, even though we only have two years of overall duration, it is concentrated in long-dated US exposure. This has been the right place to be with the massive flattening of the curve and outperformance of long-dated bonds. In many ways, having such a big flattener is the equivalent to having higher outright duration than the current two years.
Breakevens
US 10-year breakevens had rallied from 2% in January to 2.55% in May, but in the last four weeks there has been a 30bp reversal. Breakevens initially rallied after the Fed’s meeting this week, but then sold off quite aggressively in the following two days. Some have suggested that, as the Fed may raise rates earlier than expected, longer-dated inflation expectations should come down, others that breakevens should move lower as real rates move higher. Maybe it’s related to an end of QE scenario, which would mean the Fed buying far fewer TIPS1 than previously. You could expect breakevens to move higher in line with the Fed seeing more sustained inflation. Once again, we are back to having many more buyers than sellers.
We have been running 14% exposure to breakevens since March this year, but in line with a market that was moving lower, we reduced this to 9% early June, selling both 5 and 10-year TIPS.
Credit
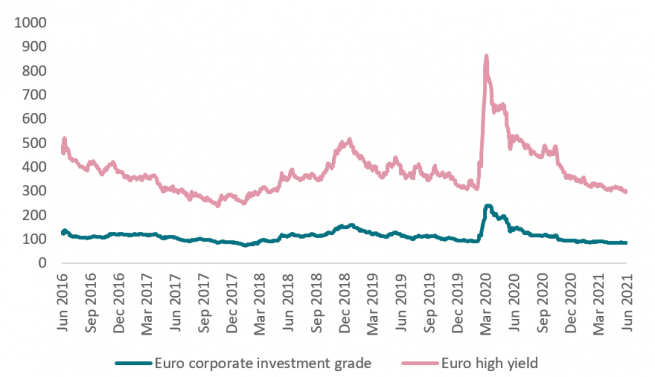
Whilst all of the above can appear somewhat dramatic for a high quality, low yielding asset class like Treasuries, credit and high yield have been quite the opposite. We are in the middle of what many have described as a “summer of carry”, whereby spreads continue to move sideways or tighter, supported by relentless investor appetite for a bit more yield than on offer in the highest quality bond markets – see below for euro credit and high yield spreads.
Whilst far from the cheapest we have seen in recent times, credit and high yield appear to be well anchored with strong demand from investors and central banks alike. We would also argue that, behind the headline yield, there is greater dispersion at a security level where we find some very tight and expensive bonds and others that still trade with a fundamental or liquidity premium.
Our big bias is towards BBB in investment grade with banks, insurers and “COVID recovery” names (property, leisure and pub sectors) featuring. In high yield, we have reduced some of the more cyclical recovery names and focus a lot in shorter-dated high carry. In emerging markets, we are transitioning away from traditional commodity sensitive areas towards both growth in middle class consumer-led sectors and a growing exposure to renewable energy names.
- Treasury Inflation-Protected Securities
Credit default swaps (CDS)
Low volatility in spreads is best demonstrated by a dormant CDS market, which has traded in a very tight range all year, and more recently has dipper lower.
With more rates and credit carry the order of the day in May, we reduced the CDS hedge to maximise the carry on the cash bonds. The insurance policy of CDS will play its part again but for the foreseeable future we are running with no CDS.
Take advantage of your free lunch
Put all that, and more, together, and some fixed income investors will be enjoying a steady but growing return year to date. Diversification proves once again to iron out the volatility of markets, but high and active conviction in rates and credit is delivering decent short and long-term returns in a low yielding but increasingly volatile market.

Find out more about fixed income investing at AXA IM
We cover a broad spectrum of fixed income strategies to help investors build diverse portfolios that can be more resilient to economic and market shifts
Find out moreNot for Retail distribution
This document is intended exclusively for Professional, Institutional, Qualified or Wholesale Clients / Investors only, as defined by applicable local laws and regulation. Circulation must be restricted accordingly.
This document is for informational purposes only and does not constitute investment research or financial analysis relating to transactions in financial instruments as per MIF Directive (2014/65/EU), nor does it constitute on the part of AXA Investment Managers or its affiliated companies an offer to buy or sell any investments, products or services, and should not be considered as solicitation or investment, legal or tax advice, a recommendation for an investment strategy or a personalized recommendation to buy or sell securities.
Due to its simplification, this document is partial and opinions, estimates and forecasts herein are subjective and subject to change without notice. There is no guarantee forecasts made will come to pass. Data, figures, declarations, analysis, predictions and other information in this document is provided based on our state of knowledge at the time of creation of this document. Whilst every care is taken, no representation or warranty (including liability towards third parties), express or implied, is made as to the accuracy, reliability or completeness of the information contained herein. Reliance upon information in this material is at the sole discretion of the recipient. This material does not contain sufficient information to support an investment decision.
Risk Warning
The value of investments, and the income from them, can fall as well as rise and investors may not get back the amount originally invested.