
US high yield: The reluctant rally
KEY POINTS
Following 2025’s volatile spring period, the US high yield (HY) market enjoyed a summer of relative calm. This came despite continued fears over US’ tariffs’ potential inflationary impact; a weakening labour market; rising tensions between the White House and key economic institutions; and the passing of the One Big Beautiful Bill – which could further widen the already burgeoning deficit over the coming years.1
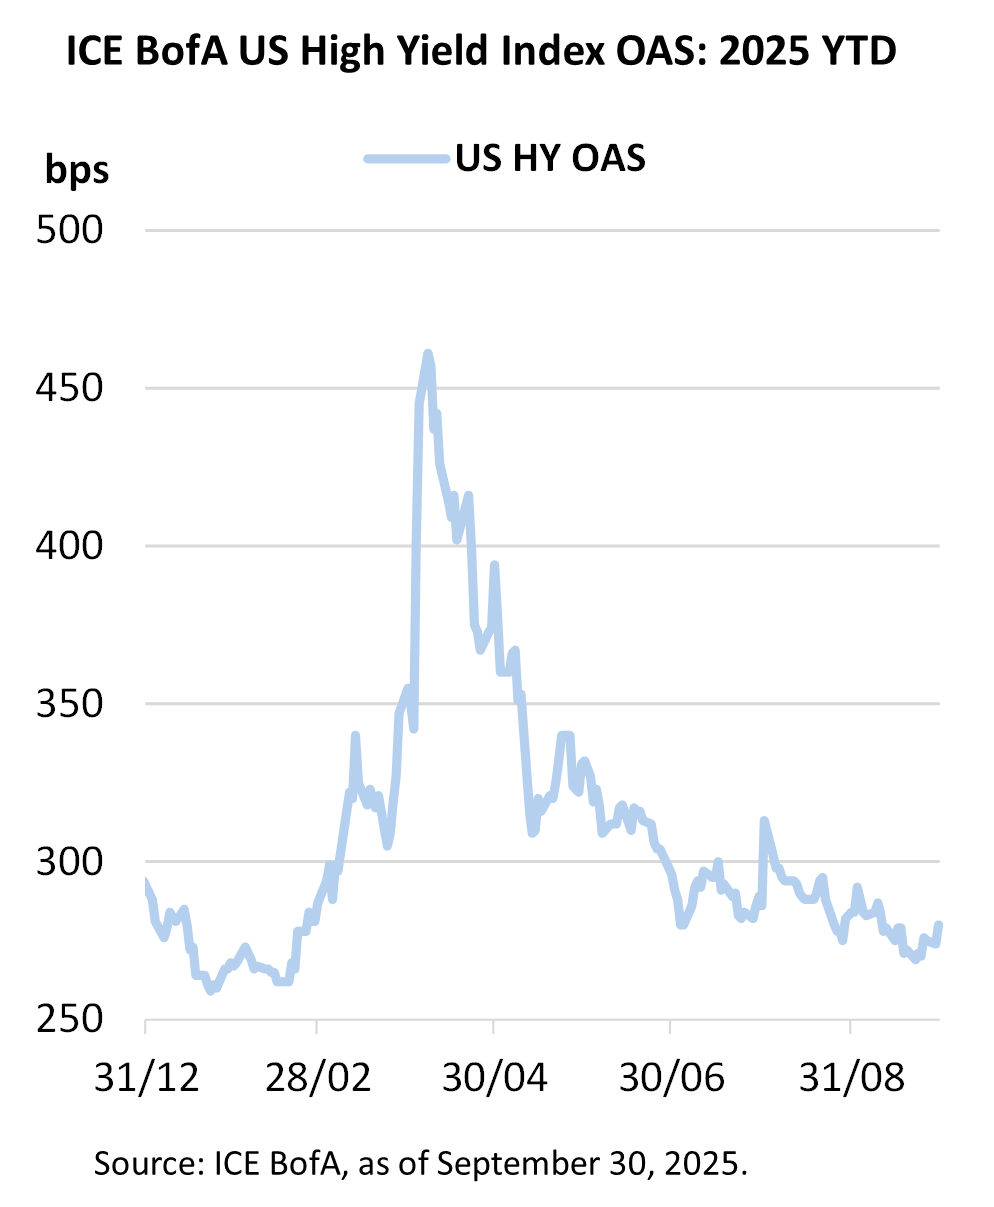
Yet today, the US HY market option-adjusted spread sits at 280 basis points (bp), in a narrower range than before Liberation Day and just 20bp wider than the levels seen in January. On the face of it, investors appear to have shrugged off the headlines and have been buoyed by better entry points – created by the tariff-related volatility - with $20bn plus of net flows into HY funds since 23 April.2
But the US HY market has not been alone in this respect, with both public and private credit markets benefitting from strong investor demand in recent months. Interestingly, equity markets have experienced a strong rally since April but that has not translated into flows – suggesting that a weaker economic outlook and expensive technology and artificial technology (AI) related valuations are driving investors towards other asset classes.
On the face of it, markets may appear to be rather complacent, especially given the high level of uncertainty. But delving deeper, there are key elements which have been supporting US HY’s rally, as we outline below:
1. Economic data points towards controlled slowdown
Economic data continues to support the theory of a controlled slowdown in the US, which is potentially supportive for HY. Consensus for third quarter (Q3) GDP is in the 1% to 2% range, although the Atlanta Fed GDPNow tracker has it as high as 3.9%.3Tariff deals have been signed with key partners such as the European Union, Japan and the UK, which offer better outcomes than the more punitive tariffs announced in April, while negotiations continue to progress with a host of other key trading partners like China. Meanwhile, inflation remains sticky but broadly in line with consensus expectations, although there is likely to be further upwards pressure from tariffs over the coming months.
Although consumer activity continues to ease and sentiment remains weak, there is no concerning demand drop-off for now. Jobs momentum has declined in recent payroll reports. This may be partly accounted for by tighter immigration, but wage growth remains positive overall - despite pressure on lower income cohorts - and unemployment is broadly in line with expectations.
This has progressively increased the market’s expectations for interest rate cuts, which the Federal Reserve (Fed) duly delivered in September, accompanied with a more dovish outlook. The absence of an upward inflation surprise makes more rate cuts more likely, which could encourage buyers and tighten spreads further into year-end.
2. Company earnings – resilient but mixed
Even as companies get more clarity on tariffs’ impacts on their supply chains and margins, there was still a resilient undertone to the recent earnings season for HY issuers. But that is not being felt equally at a sector or issuer level. Overall, HY issuers are showing better-than-expected top line growth, offset partially by an eroding bottom line. On tariffs, impacts are increasingly uneven. Sectors like Retail, Consumer Goods, Paper/Packaging, Chemicals and Autos are more affected compared to more domestically focused, low import sectors like Services, Gaming as well as Technology and Telecommunications. In certain cases, tariffs could even offer a potential tailwind in the form of reduced foreign competition – especially when combined with changes to corporate taxation passed in the One Big Beautiful Bill which incentivised domestic capital expenditure.
Telecommunications is a good example of a sector benefitting from these tailwinds. It has been boosted further by the tremendous amount of capital being put to work in the AI-related ecosystem. This is supporting several large, distressed capital structures in the space, which has removed near-term default risk for positively impacted companies. Other HY companies such as semiconductors, engineering firms, industrials and construction services are already showing the positive impact of AI and data centre spending in their earnings and future plans.
Retail sector trends however warrant attention due to lower-income consumers, while middle- and upper-income consumers are trading down, and private label4 is outperforming. Tariffs have not been fully passed through, but Q2 reports pointed to increasing costs and the likelihood of it driving higher prices at the store. In Gaming, regionals continue to perform well but Las Vegas had a weak summer due to less group demand, fewer entertainment acts and a drop-off in international visits (notably from Canada). Cruise liners continue to perform well.
Most importantly, HY issuer fundamentals remain solid and point towards further containment in overall default rates. That default rate remains at just 0.49% for HY bonds excluding distressed exchanges, or 1.39% including distressed exchanges.5 The total volume of default/ liability management exercises (LME) activity across HY bonds and loans combined also fell to a 31-month low in July, suggesting issuers are finding ways to adapt to the current environment.
3. Abundant supply of capital available to issuers
The strong technical factors across HY and all leveraged finance has come under scrutiny in 2025. At the start of the year, there was speculation about the new administration’s desire to boost merger and acquisitions (M&A) activity after a stagnant period, which may have contributed to a weakening technical through increased supply. That has been pushed out due to tariff uncertainty but may return as those risks fade. There is also a question as to where that M&A-related issuance gets financed. Over the recent years, direct lending has become the primary venue for M&A and leveraged buyout (LBO) activity. The significant volume of cross-market refinancings between loans and private credit points to huge competition for deals between those two markets. They remain the premier destinations for private equity sponsored buyouts due to greater flexibility and closer synergies. This has, in turn, shifted risk away from the HY market and contributed to a deterioration in credit quality in the loan market.
In the US HY market, new issuance has picked up significantly from the nadir in April, as issuers have taken advantage of declining yields. June and July saw the heaviest capital market activity for HY ($37bn each month) since September 2021 ($44bn). September’s volume was even larger at $49bn.6
Importantly, new supply remains refinancing focused, with proceeds used for refinancing accounting for 72% of the $258bn total HY issue volume YTD. Combined HY and loan refinancing activity totalled $51bn in August following a 13-month high $67bn in July and $51bn in June.7 This has allowed issuers to continue chipping away at upcoming maturities, with a very manageable maturity wall for both HY and loans over the next couple of years, as the chart shows.
High yield and loan maturities
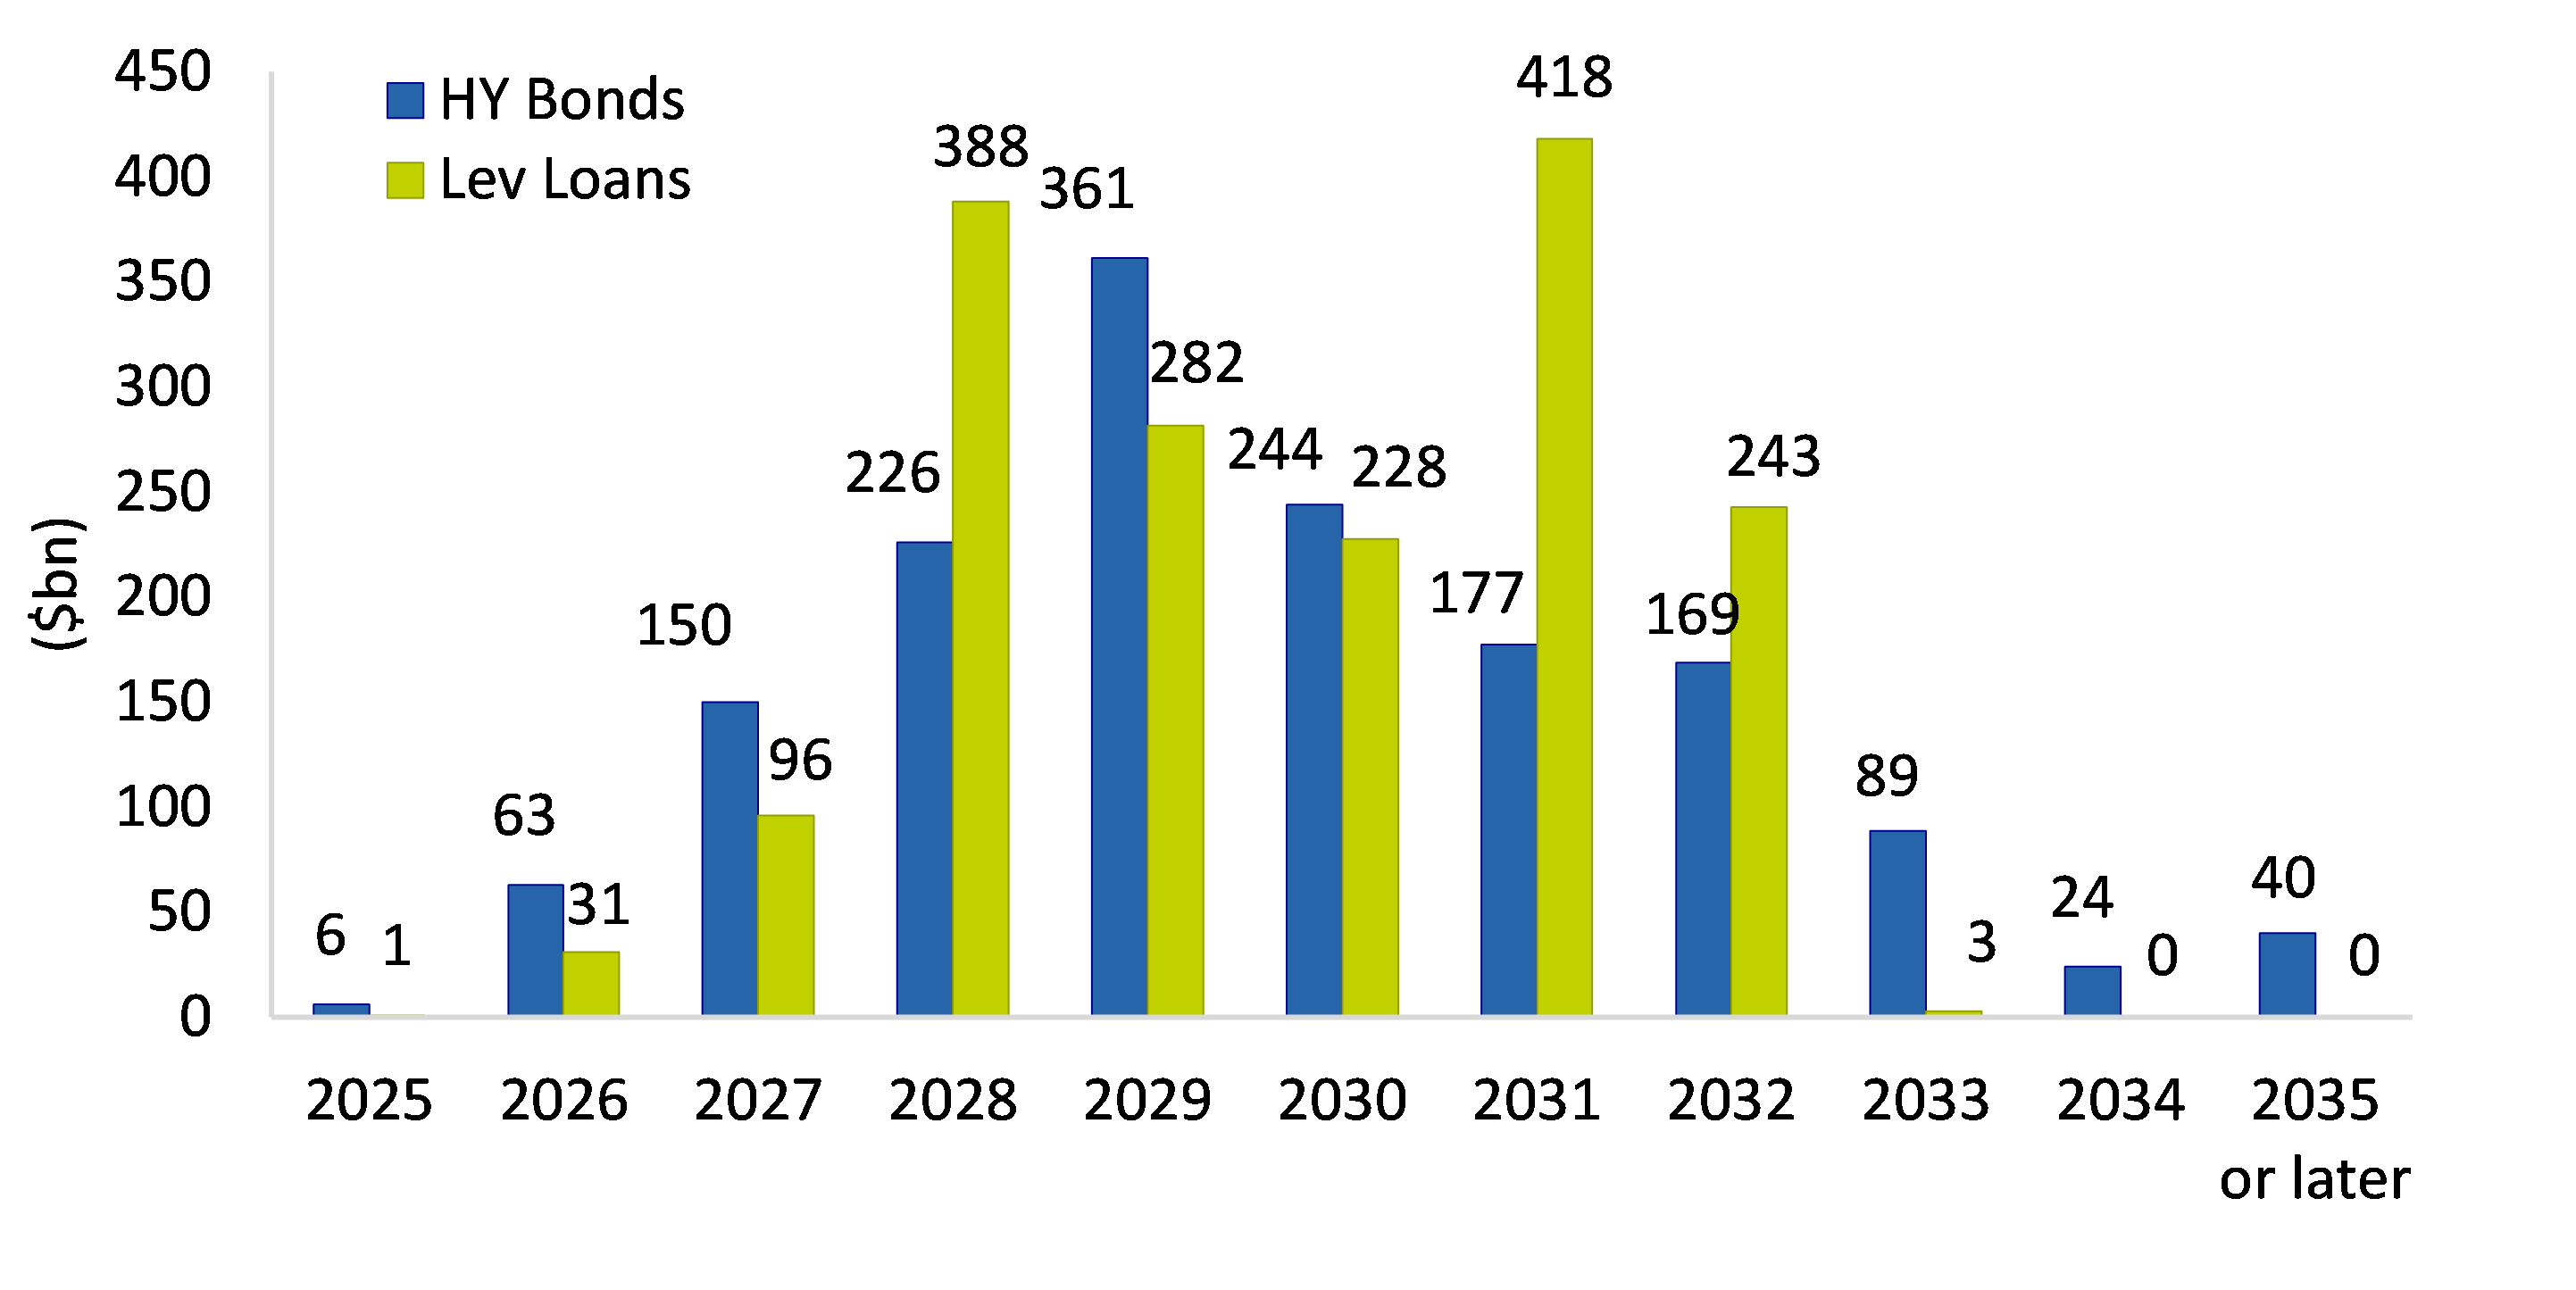
Source: J.P. Morgan: Maturity Schedule HY Bonds and Loans, data as of August 19, 2025.
What has been most notable – even at the height of April’s volatility – has been the strength in demand for new paper, with overall sources of demand continuing to outstrip supply year to date, albeit at a more balanced rate than the last three years.
On the supply side, there has been an uptick in the volume of fallen angels, surpassing rising stars so far this year,8with some notable additions to the US HY index like Nissan Motor and Warner Bros Discovery. Overall credit trends remain healthy, and issuance is tilted towards higher quality, leading to further growth in the percentage of BB-rate bonds in the US HY market, but this warrants monitoring for its potential impact on technical factors moving forward – with the prospect of one or two large fallen angel candidates on the horizon.
4. Yields continue to point to attractive total return prospects
While spreads have tightened, a lot of the capital that has come into the HY market is from buyers focused on the higher total yields on offer, rather than just the spread component.
As volatility has subsided following 2022’s drawdown, income is now accounting for a higher percentage of total returns, as it should do over the long term.
In fact, the rolling 12M income return for the US HY market has now stabilised around the 7% mark, having been below 5% in 20229. This income return should continue to improve as new bonds issued in the low-rate years of 2020-2021 are refinanced at today’s yield levels.
Lower interest rates may encourage further cash buyers, particularly for more defensive HY strategies. Higher total return seeking HY strategies, on the other hand, may continue to benefit from rotation out of equities.
As we look ahead to Q4, we expect dispersion in HY to remain elevated. This is because a slowing economy and tariffs continue to have idiosyncratic impacts across sectors and issuers. That said, we expect spreads to remain supported by solid corporate fundamentals, low defaults and continued investor demand from yield buyers contributing to a positive technical.
It is also worth remembering that, while spreads appear low in a historical context, they are less so when adjusted for today’s US HY market composition. Today’s spread levels are supported by a near record high percentage of BBs; a near record low percentage of CCCs; a record high percentage of secured bonds; record low duration and low bid/ask spreads (i.e. better liquidity). Despite the challenging macroeconomic environment, which could lead to short bouts of volatility, like we saw in April, spread tightening may still have some room to run.
- ‘OBBB’ stands for “One Big Beautiful Bill’
- Source: J.P. Morgan Research, as of September 17, 2025.
- Source: Atlanta Fed, latest estimate as of September 26, 2025.
- Private label refers to retailers selling labels under their own brand name which are made by a third-party manufacturer
- Source: J.P. Morgan Research, Default Monitor as of September 30, 2025.
- Source: JP Morgan Research, as of 26 September 2025.
- Source: JP Morgan Research, as of 26 September 2025.
- Source: JP Morgan Research as of 26 September 2025
- Source: Bloomberg, as of 26 September 2025. Calculated on a daily basis


Disclaimer
This document is for informational purposes only and does not constitute investment research or financial analysis relating to transactions in financial instruments as per MIF Directive (2014/65/EU), nor does it constitute on the part of AXA Investment Managers or its affiliated companies an offer to buy or sell any investments, products or services, and should not be considered as solicitation or investment, legal or tax advice, a recommendation for an investment strategy or a personalised recommendation to buy or sell securities.
Due to its simplification, this document is partial and opinions, estimates and forecasts herein are subjective and subject to change without notice. There is no guarantee forecasts made will come to pass. Data, figures, declarations, analysis, predictions and other information in this document is provided based on our state of knowledge at the time of creation of this document. Whilst every care is taken, no representation or warranty (including liability towards third parties), express or implied, is made as to the accuracy, reliability or completeness of the information contained herein. Reliance upon information in this material is at the sole discretion of the recipient. This material does not contain sufficient information to support an investment decision.
Issued in the UK by AXA Investment Managers UK Limited, which is authorised and regulated by the Financial Conduct Authority in the UK. Registered in England and Wales No: 01431068. Registered Office: 22 Bishopsgate London EC2N 4BQ
In other jurisdictions, this document is issued by AXA Investment Managers SA’s affiliates in those countries.
Risk Warning
The value of investments, and the income from them, can fall as well as rise and investors may not get back the amount originally invested.