

That’s so early-January 2026!
Not so long ago, investors were assessing the significance of the arrest of Venezuelan President Nicolás Maduro. That now seems like the distant past after recent tensions over Greenland.
For all the headlines, the market impact of the Trump administration’s efforts to acquire Greenland were limited. At the low point for equity markets on 20 January, US and European markets were down just 2% compared to the 9% to 12% declines following Liberation Day in April last year. The gold price rose further, up 4%, as there are nonetheless longer-term implications for investors from the significant changes in geopolitics and global trade that continue to unfold.
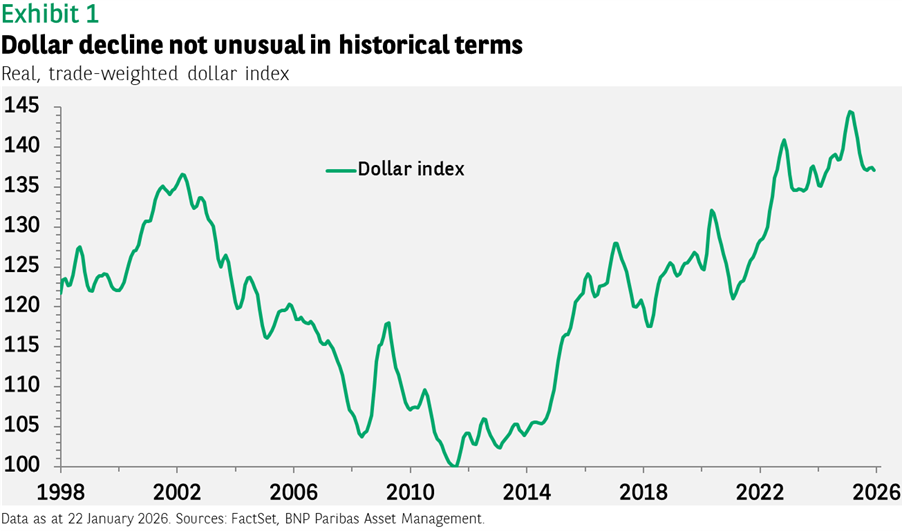
Another asset that could see a more meaningful price impact is the US dollar as foreign investors sour on the appeal of US assets (the so-called “sell America” trade). While this is certainly a factor for some, it is not clear that the dollar has moved much because of it. The greenback lost just $0.01 of value versus the euro over the last few days. In 2025, it fell 5% in real, trade-weighted terms, but this followed a nearly 50% appreciation since 2011 and is less than the 9% decline seen during the first Trump administration (see Exhibit 1).
Moreover, foreigners are not in fact selling US assets. In the seven months since Liberation Day, net foreign purchases of US assets totalled $1.2trn, nearly double the inflows in the seven months prior.
The near-term consequences for markets and economic growth of events in Iran, Venezuela and Greenland are not clear, and as a result, the muted reaction of markets is correct in our view. If one believes lower oil prices may be the result, then the impact should be positive.
Rotation or rebalancing
One expectation for equity investors in 2026 is that index returns will be more balanced between technology and non-technology sectors, with some even looking for a rotation from growth to value resulting in superior value-sector returns.
To some degree this has occurred. Since the beginning of the year, the Russell 1000 Value index has outperformed the Nasdaq 100 by three percentage points after underperforming by 6ppt in 2025 (see Exhibit 2).
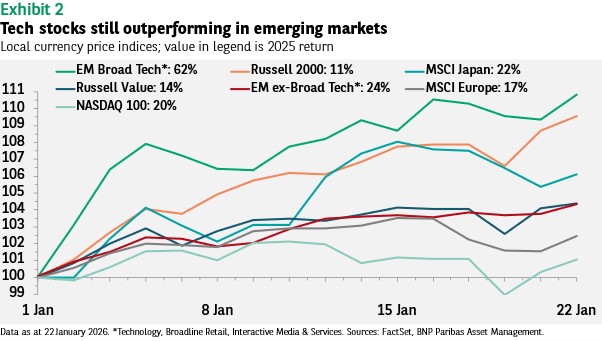
In emerging markets (EM), however, this has not been the case. It is important to recognise that the technology sector has been as important a driver of EM performance as it has been in the US. The gap between the performance of tech and non-tech sectors in emerging markets in 2025 was even greater than that between the Nasdaq 100 and Russell Value, with EM tech beating non-tech EM by nearly 40ppt.
That pattern has continued this year. EM tech stocks (primarily in Taiwan, China and Korea) have gained 11% so far in 2026 compared to just a 4% gain for non-tech. Given what we expect will be a positive earnings season for US tech stocks, and a superior earnings outlook for the year, we anticipate the lagging Nasdaq 100 index will regain the upper hand in the months ahead.
The outlook then is not for non-tech outperformance but for a narrowing of the gap between the two. In a sense this has to happen. Concerns about an artificial intelligence bubble remain, with the fundamental questions being how tech companies will make a return on their significant capital expenditure investments. The necessary evolution of the AI revolution has to be that tech companies sell their products to non-tech companies, who then use the technology to either increase revenues and/or cut costs, leading to faster earnings-per-share growth. If this does not occur, then worries about an AI bubble may turn out to have been well founded.


Disclaimer
This document is for informational purposes only and does not constitute investment research or financial analysis relating to transactions in financial instruments as per MIF Directive (2014/65/EU), nor does it constitute on the part of BNP PARIBAS ASSET MANAGEMENT Europe or its affiliated companies an offer to buy or sell any investments, products or services, and should not be considered as solicitation or investment, legal or tax advice, a recommendation for an investment strategy or a personalized recommendation to buy or sell securities.
Due to its simplification, this document is partial and opinions, estimates and forecasts herein are subjective and subject to change without notice. There is no guarantee forecasts made will come to pass. Data, figures, declarations, analysis, predictions and other information in this document is provided based on our state of knowledge at the time of creation of this document. Whilst every care is taken, no representation or warranty (including liability towards third parties), express or implied, is made as to the accuracy, reliability or completeness of the information contained herein. Reliance upon information in this material is at the sole discretion of the recipient. This material does not contain sufficient information to support an investment decision.
Issued in the UK by AXA Investment Managers UK Limited, which is authorised and regulated by the Financial Conduct Authority in the UK. Registered in England and Wales, No: 01431068. Registered Office: 22 Bishopsgate, London, EC2N 4BQ.
Risk warning
The value of investments, and the income from them, can fall as well as rise and investors may not get back the amount originally invested.
AXA IM and BNPP AM are progressively merging and streamlining our legal entities to create a unified structure
AXA Investment Managers joined BNP Paribas Group in July 2025. Following the merger of AXA Investment Managers Paris and BNP PARIBAS ASSET MANAGEMENT Europe and their respective holding companies on December 31, 2025, the combined company now operates under the BNP PARIBAS ASSET MANAGEMENT Europe name.